Workplace Analytics
Visualize the network of knowledge
Neelix Feedback Platform aggregates measurable real-time feedback and provides insights into what is going on in reality.

Organizational Insights via Dashboards, Benchmarks and Analytics
Custom Dashboards and Benchmarks
Build dashboards and employee experience bechmarks specific to themes, activities, departments or across the organization. Solicit additional triangulation data points from team activists.
Mind Map
Real-time heatmap tree of themes built from team journal posts. More details.
Seamless Data Flow
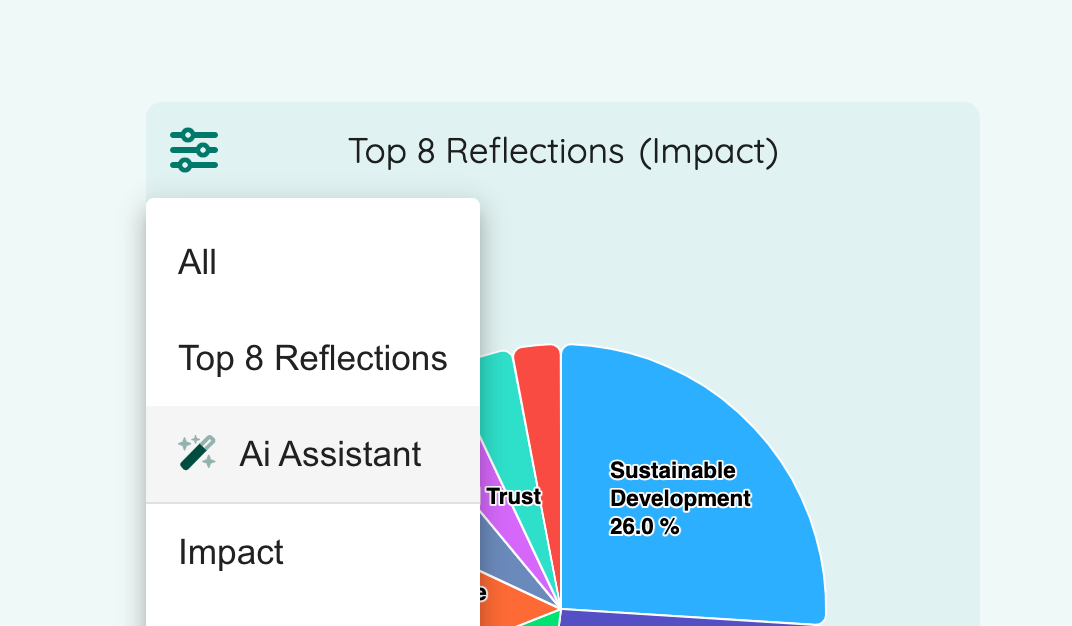
Experiences posted by users of the Consortium flow straight away into 17 rich charts
Multiple Lenses
Data can be filtered by Teams, Experience categories, Activities, Impact weight, Time span
Psychological Safety
Contextual and measurable insights into the spectrum of experiences and feelings
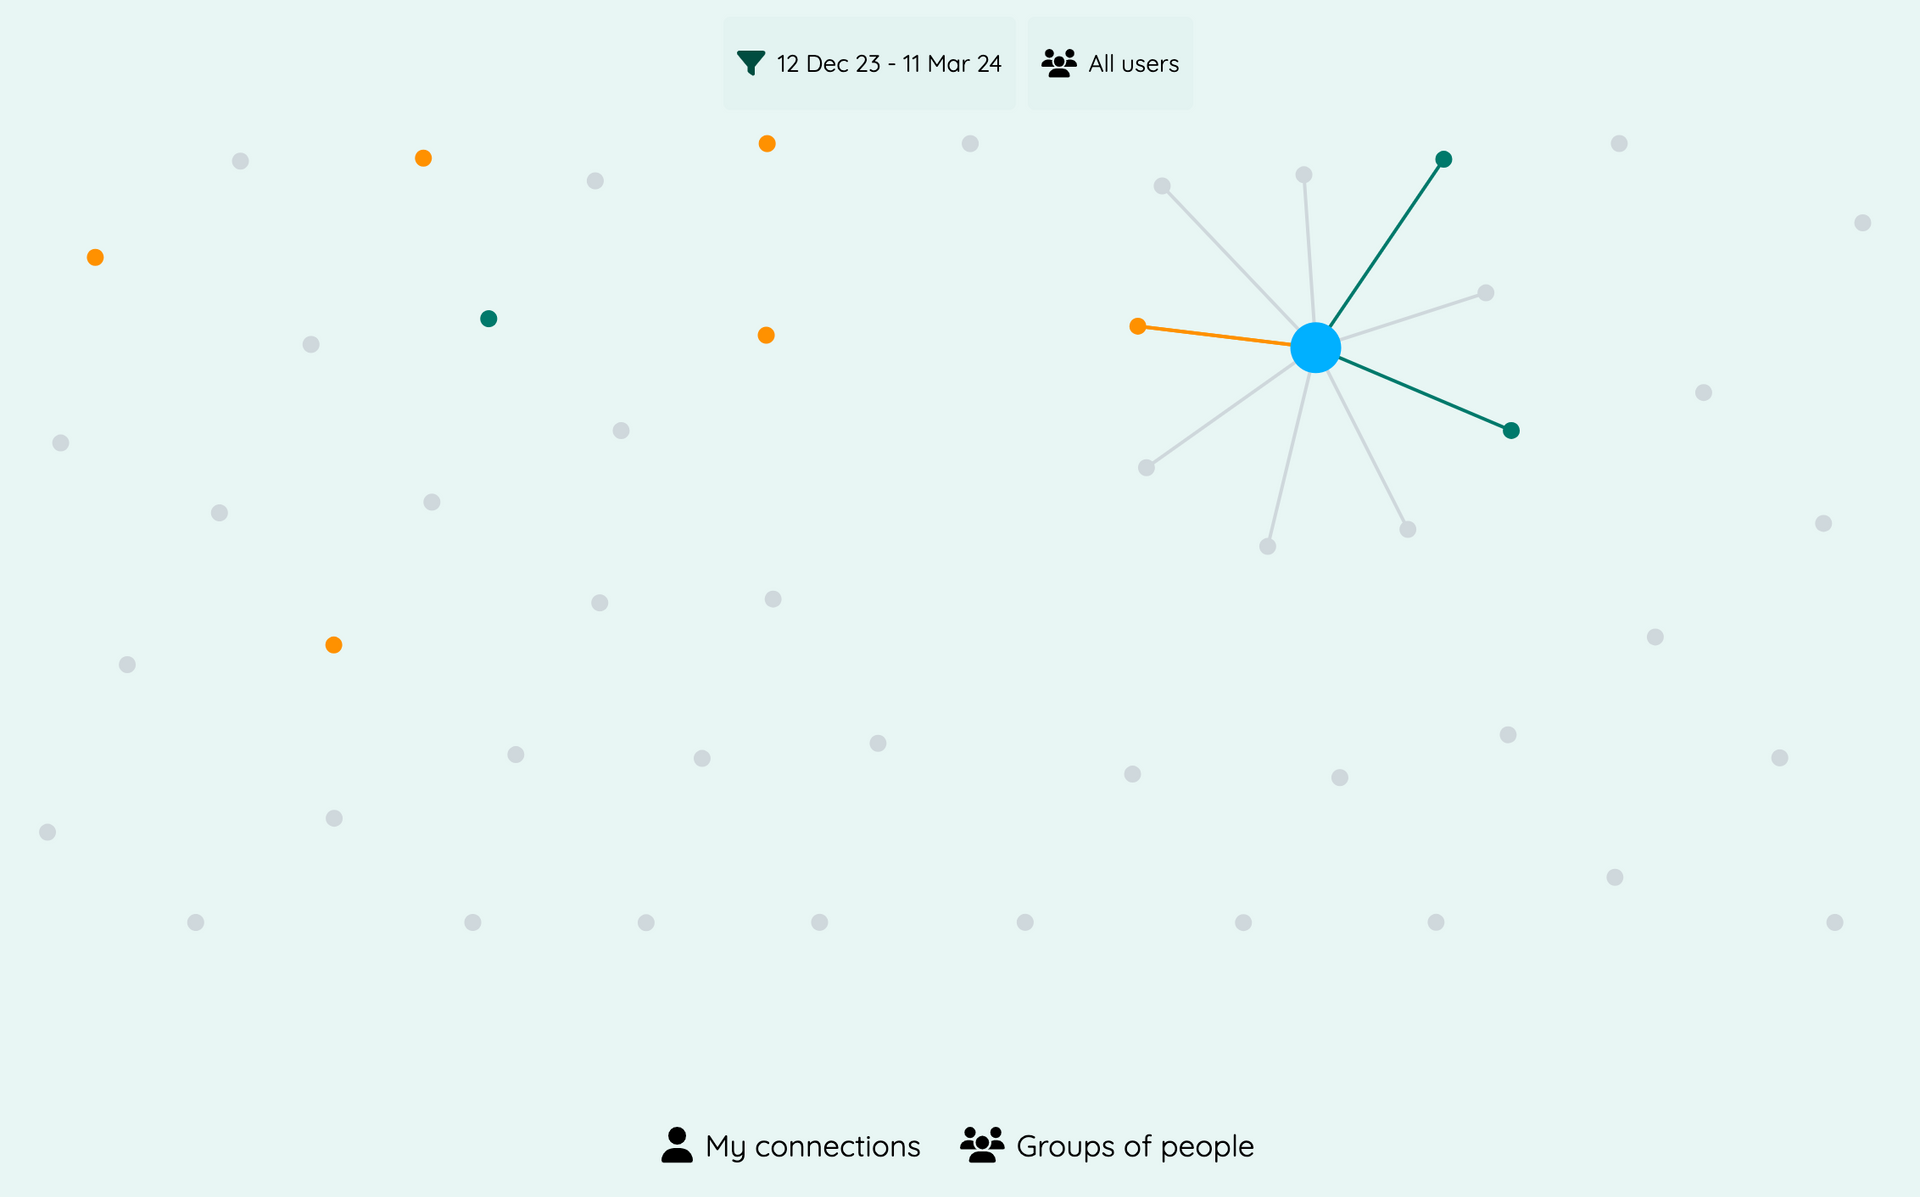
Buddy Ecosystem
Real-time network map as big picture view into employee engagement, connections between people, potentially isolated employees
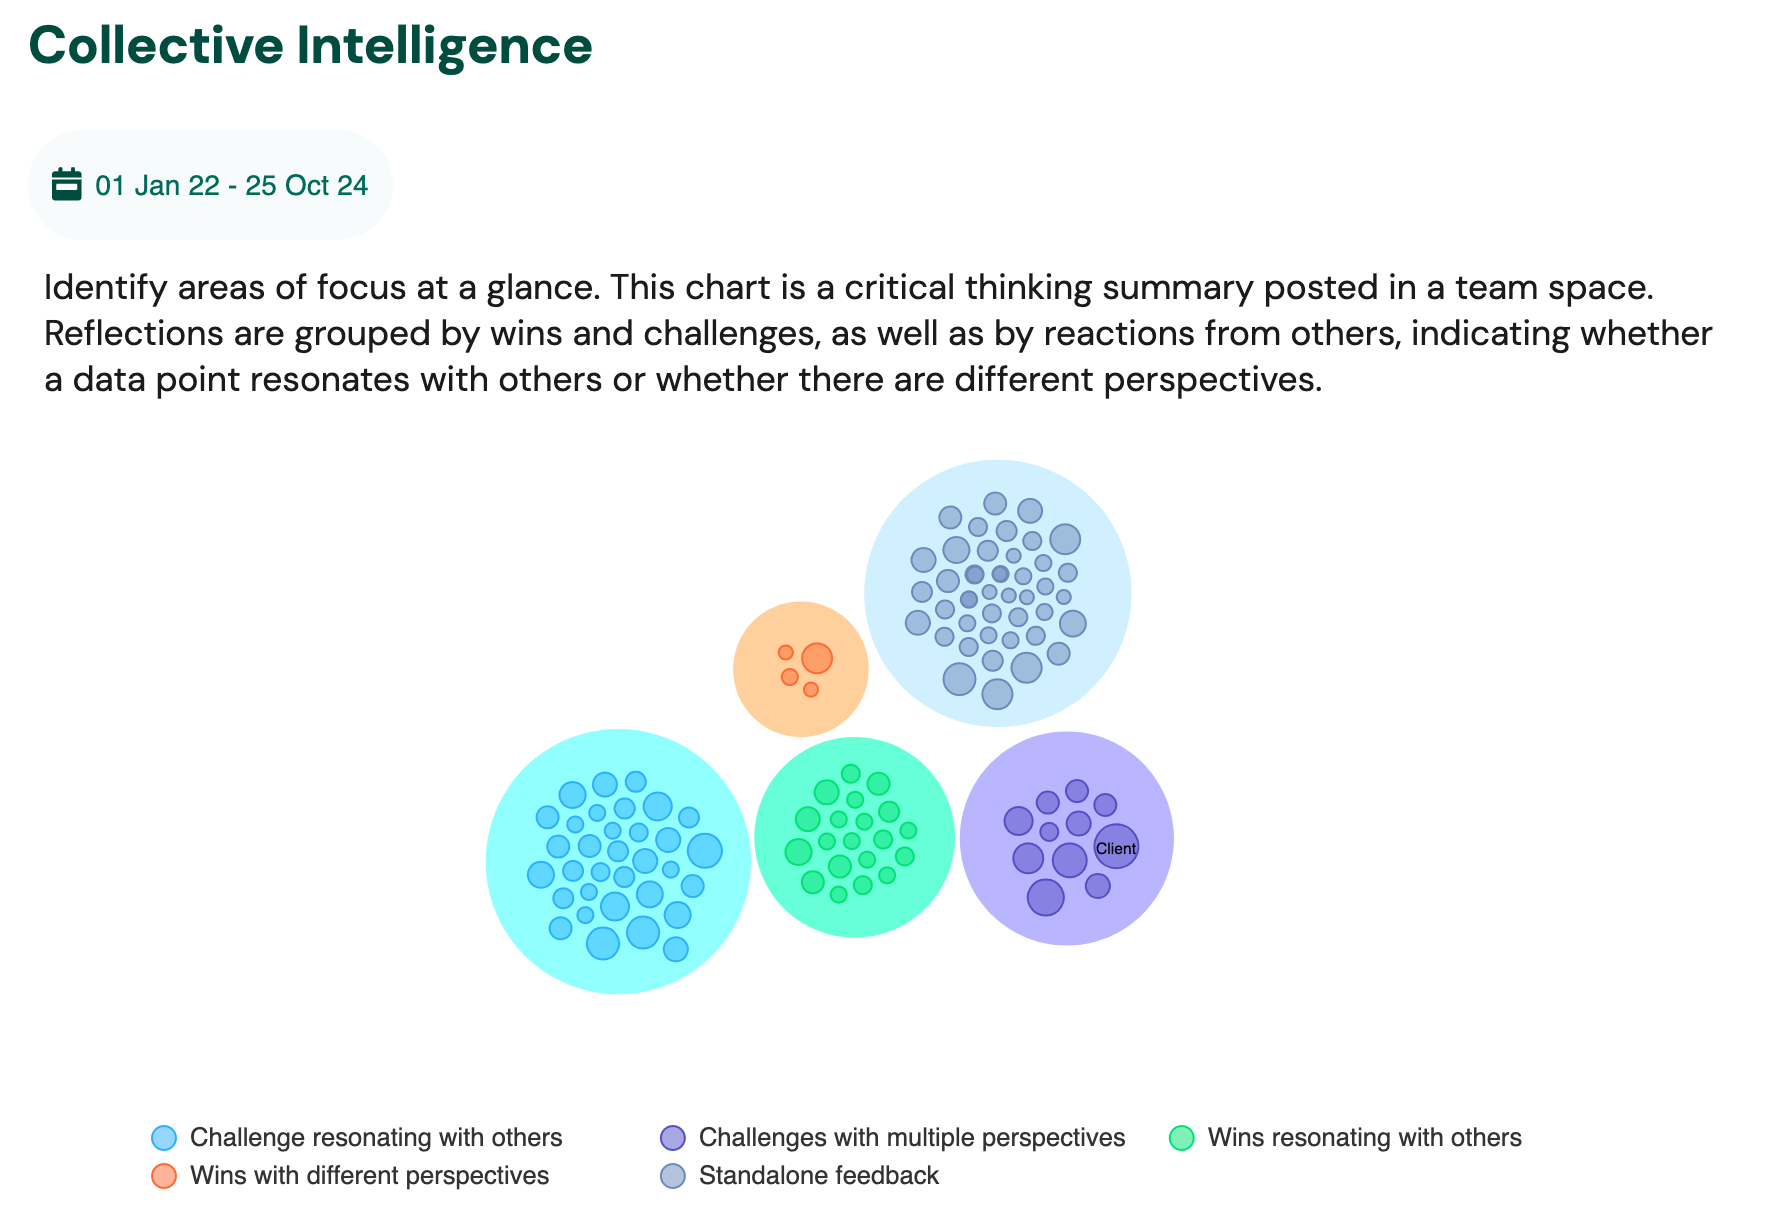
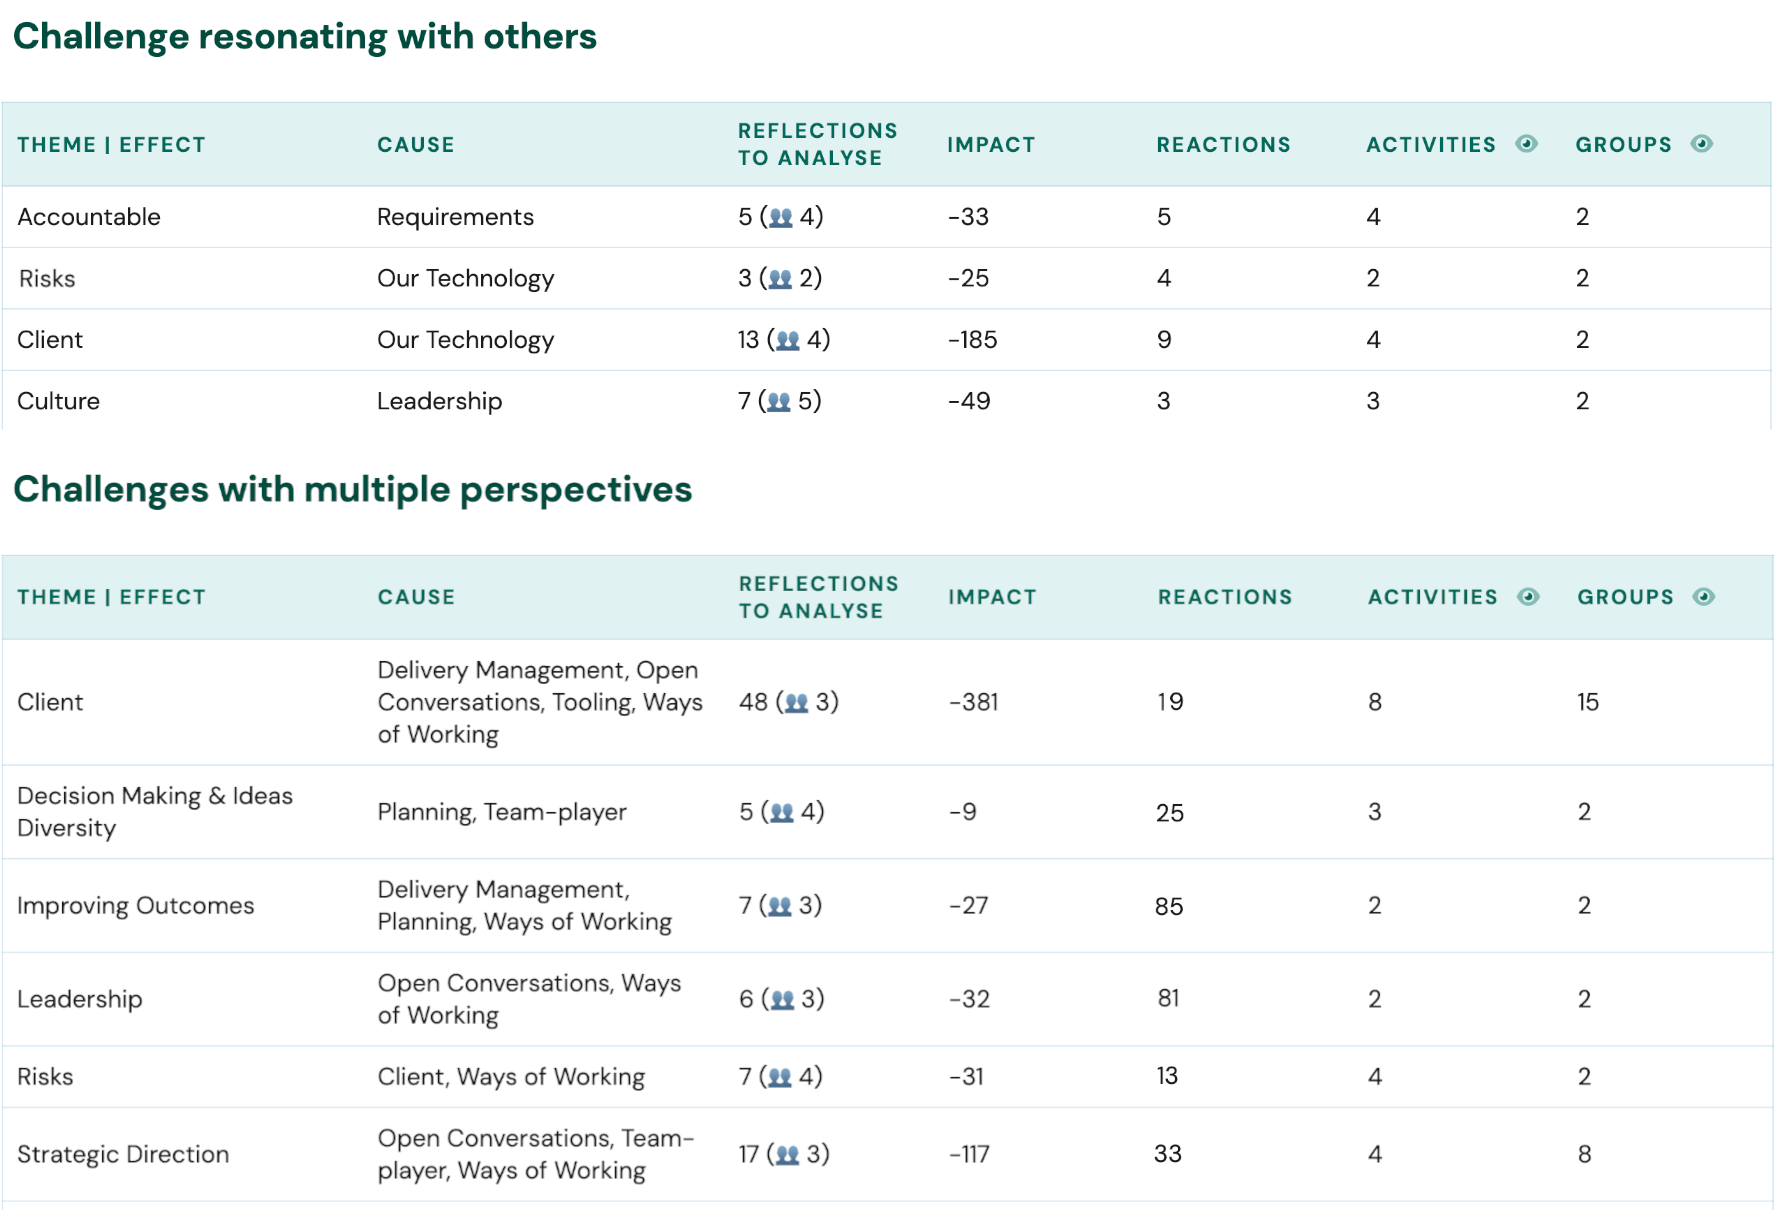
Contextual Drill-Down
- Psychological safety themes chart providing insights per theme via median, deviations, maximum and minimum measure of sentiment
- Triangulated experiences chart (overlay journal, retrospective and time capsule message trends)
- Connections between experience categories
- Stacked categories trends for journal posts
- Stacked categories trends for retrospective conversations
- Activities scatter diagram
- Teams scatter diagram
- Major events bubble chart
- Journal level / consortia scatter diagram
- Causality connections chart
- Retrospective
- Time capsule messages charts
- Expectation's analysis chart
- Histogram charts for journal and retrospective feedback
- Bell curve charts for journal and retrospective feedback
- Triangulation of experiences
Integrated Ai Assistant
Get easy insights into "what does this mean?".
Our Ai assistants are carefully curated to identify actionable insights without breaking a social contract of trust.
Neelix.IO approach avoids "Ai hallucination" because of the authenticity of source data.
Giving the quiet majority a voice
Improving human connections
Helping remote work culture
Easy way to manage sync-ups
“There are two ways to be fooled. One is to believe what isn't true; the other is to refuse to believe what is true.”
– Soren Kierkegaard