Better Decision-Making
via Employee Experience Insights
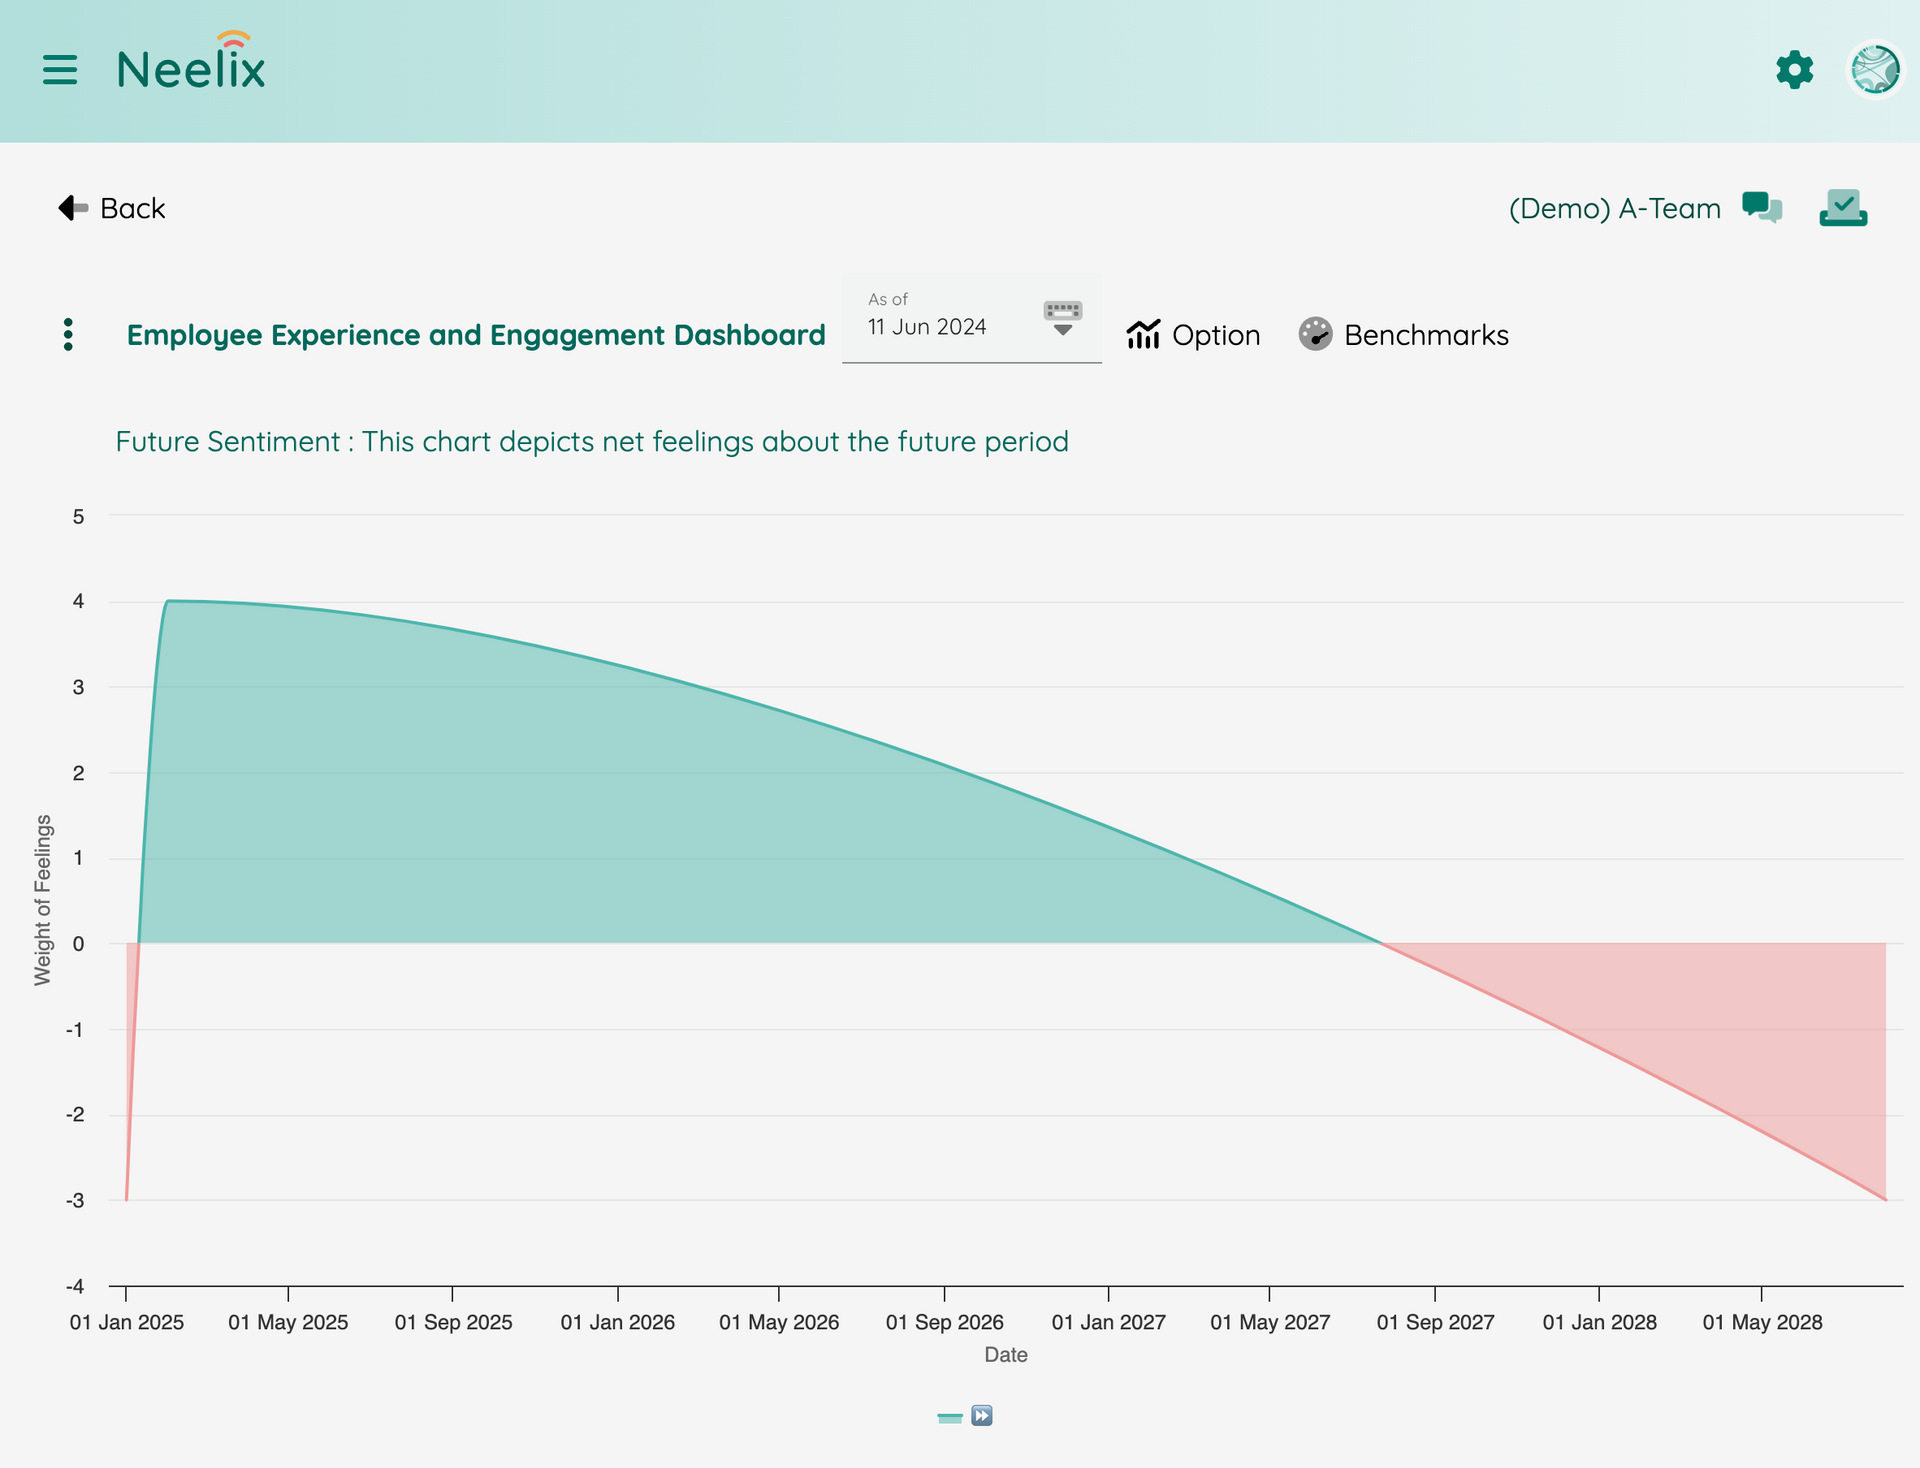
Real-time and Authentic

Data Driven & Authentic
Data points come directly from people
Highly Efficient
Reduce the need for traditional surveys
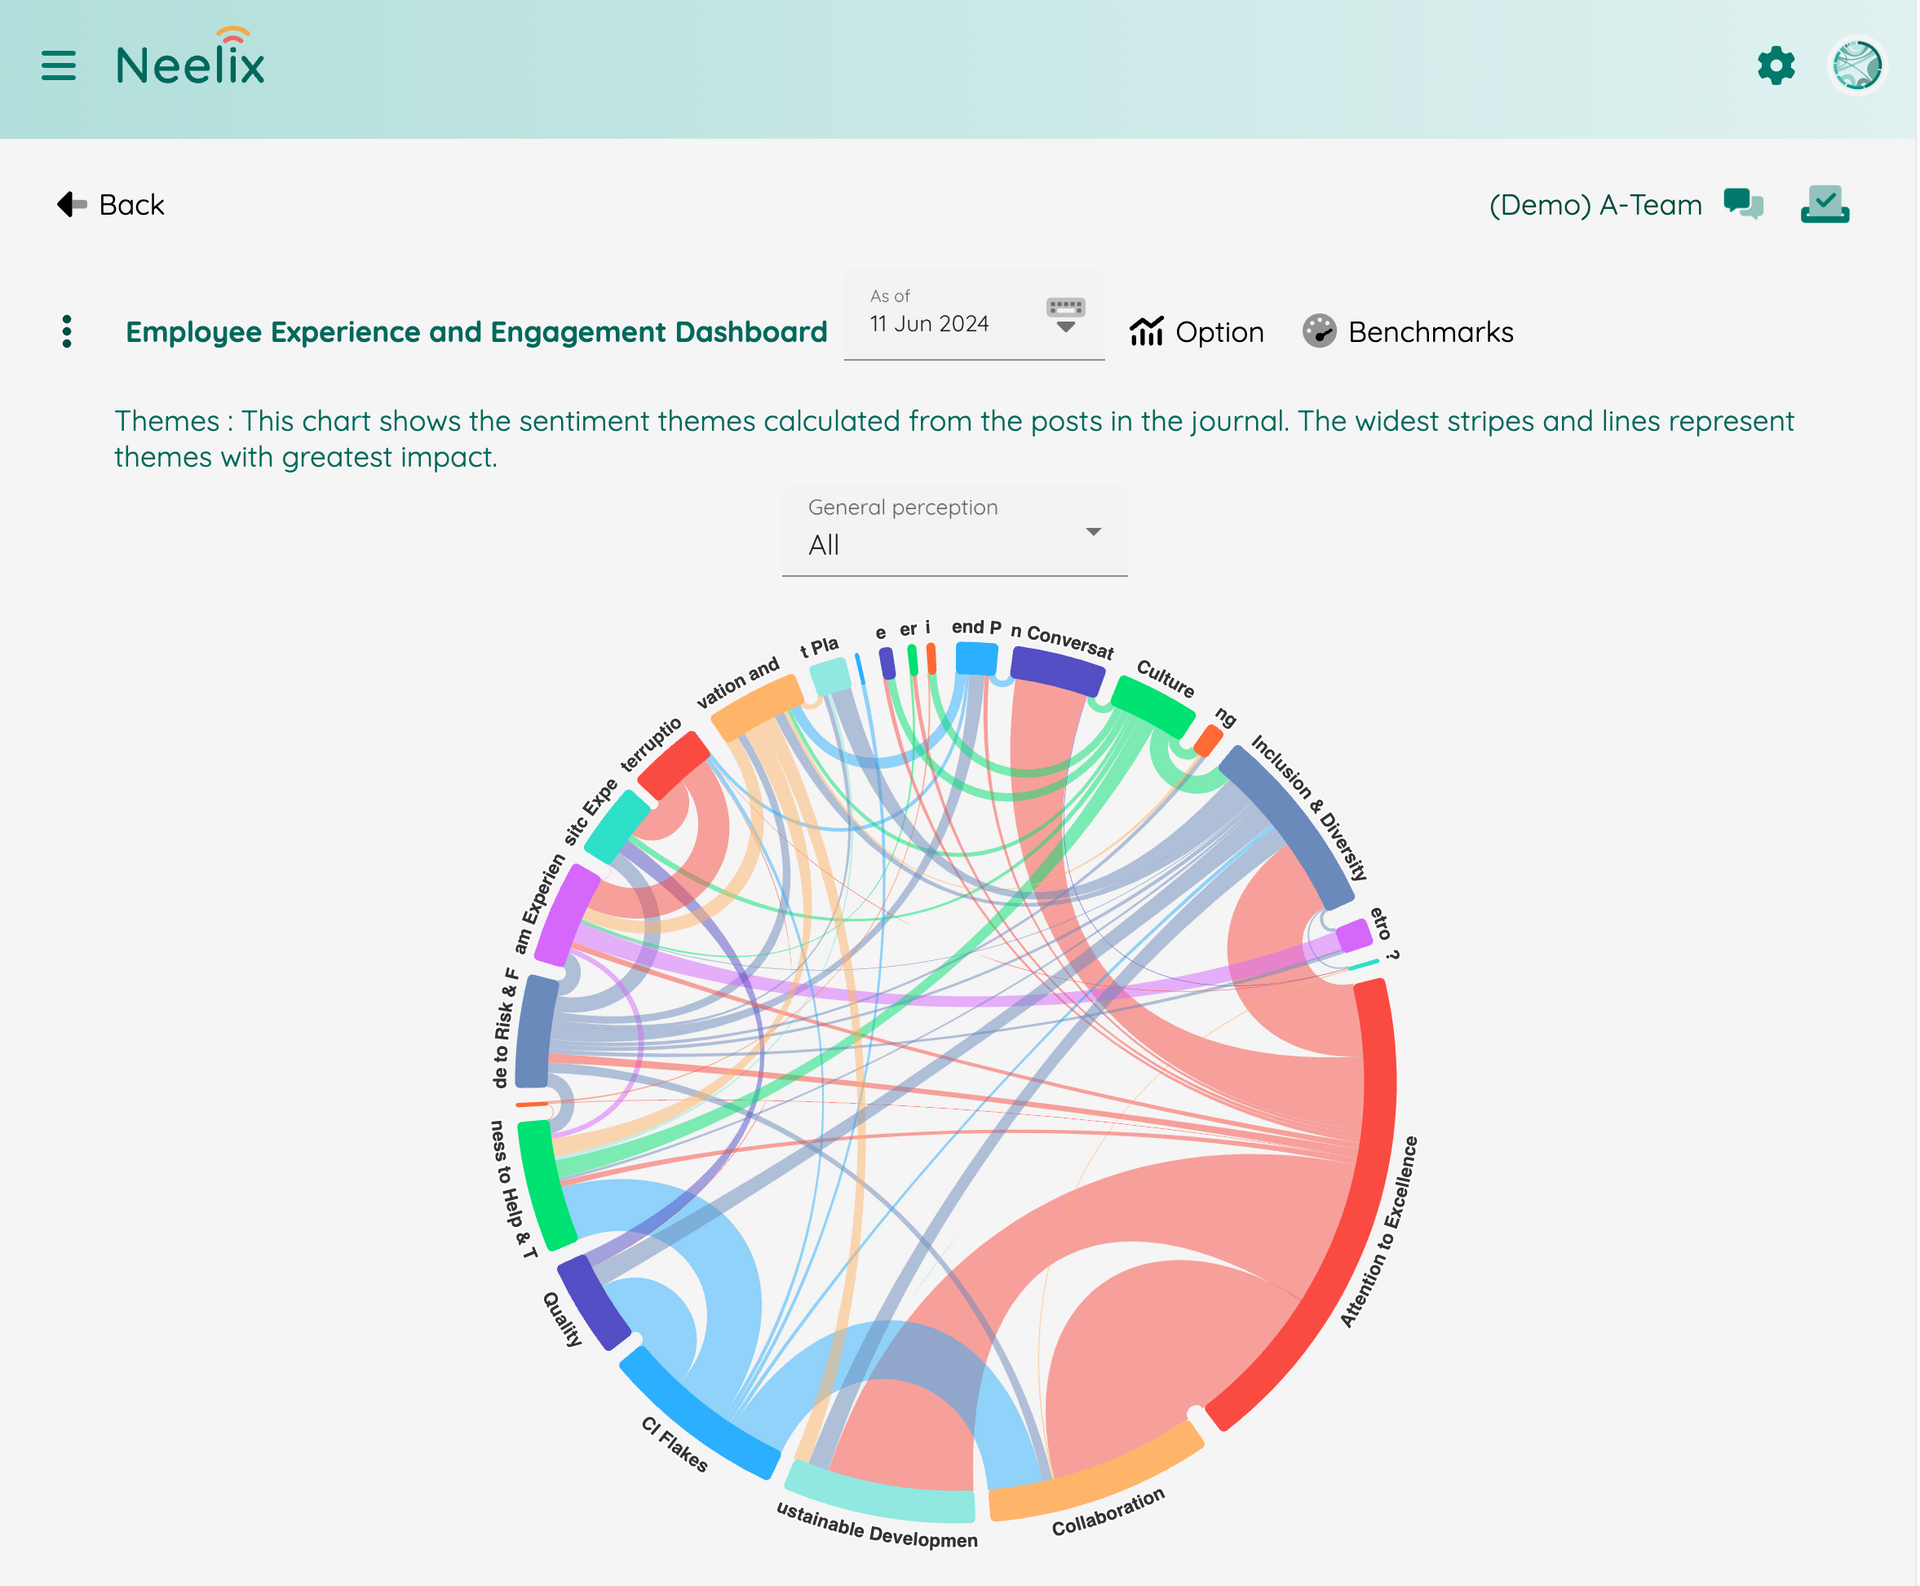
Insightful & Flexible
Construct any benchmark
Simple & Powerful
We make life simpler for anyone who needs to obtain and use workplace analytics

Closer to people
Spend less time "administering" surveys. Spend more time facilitating conversations.

Greater value
Add value by building bridges between perspectives. Bring data driven insights into conversations.

Greater impact
Be the catalyst for making better business decisions that improve performance and employee experience.
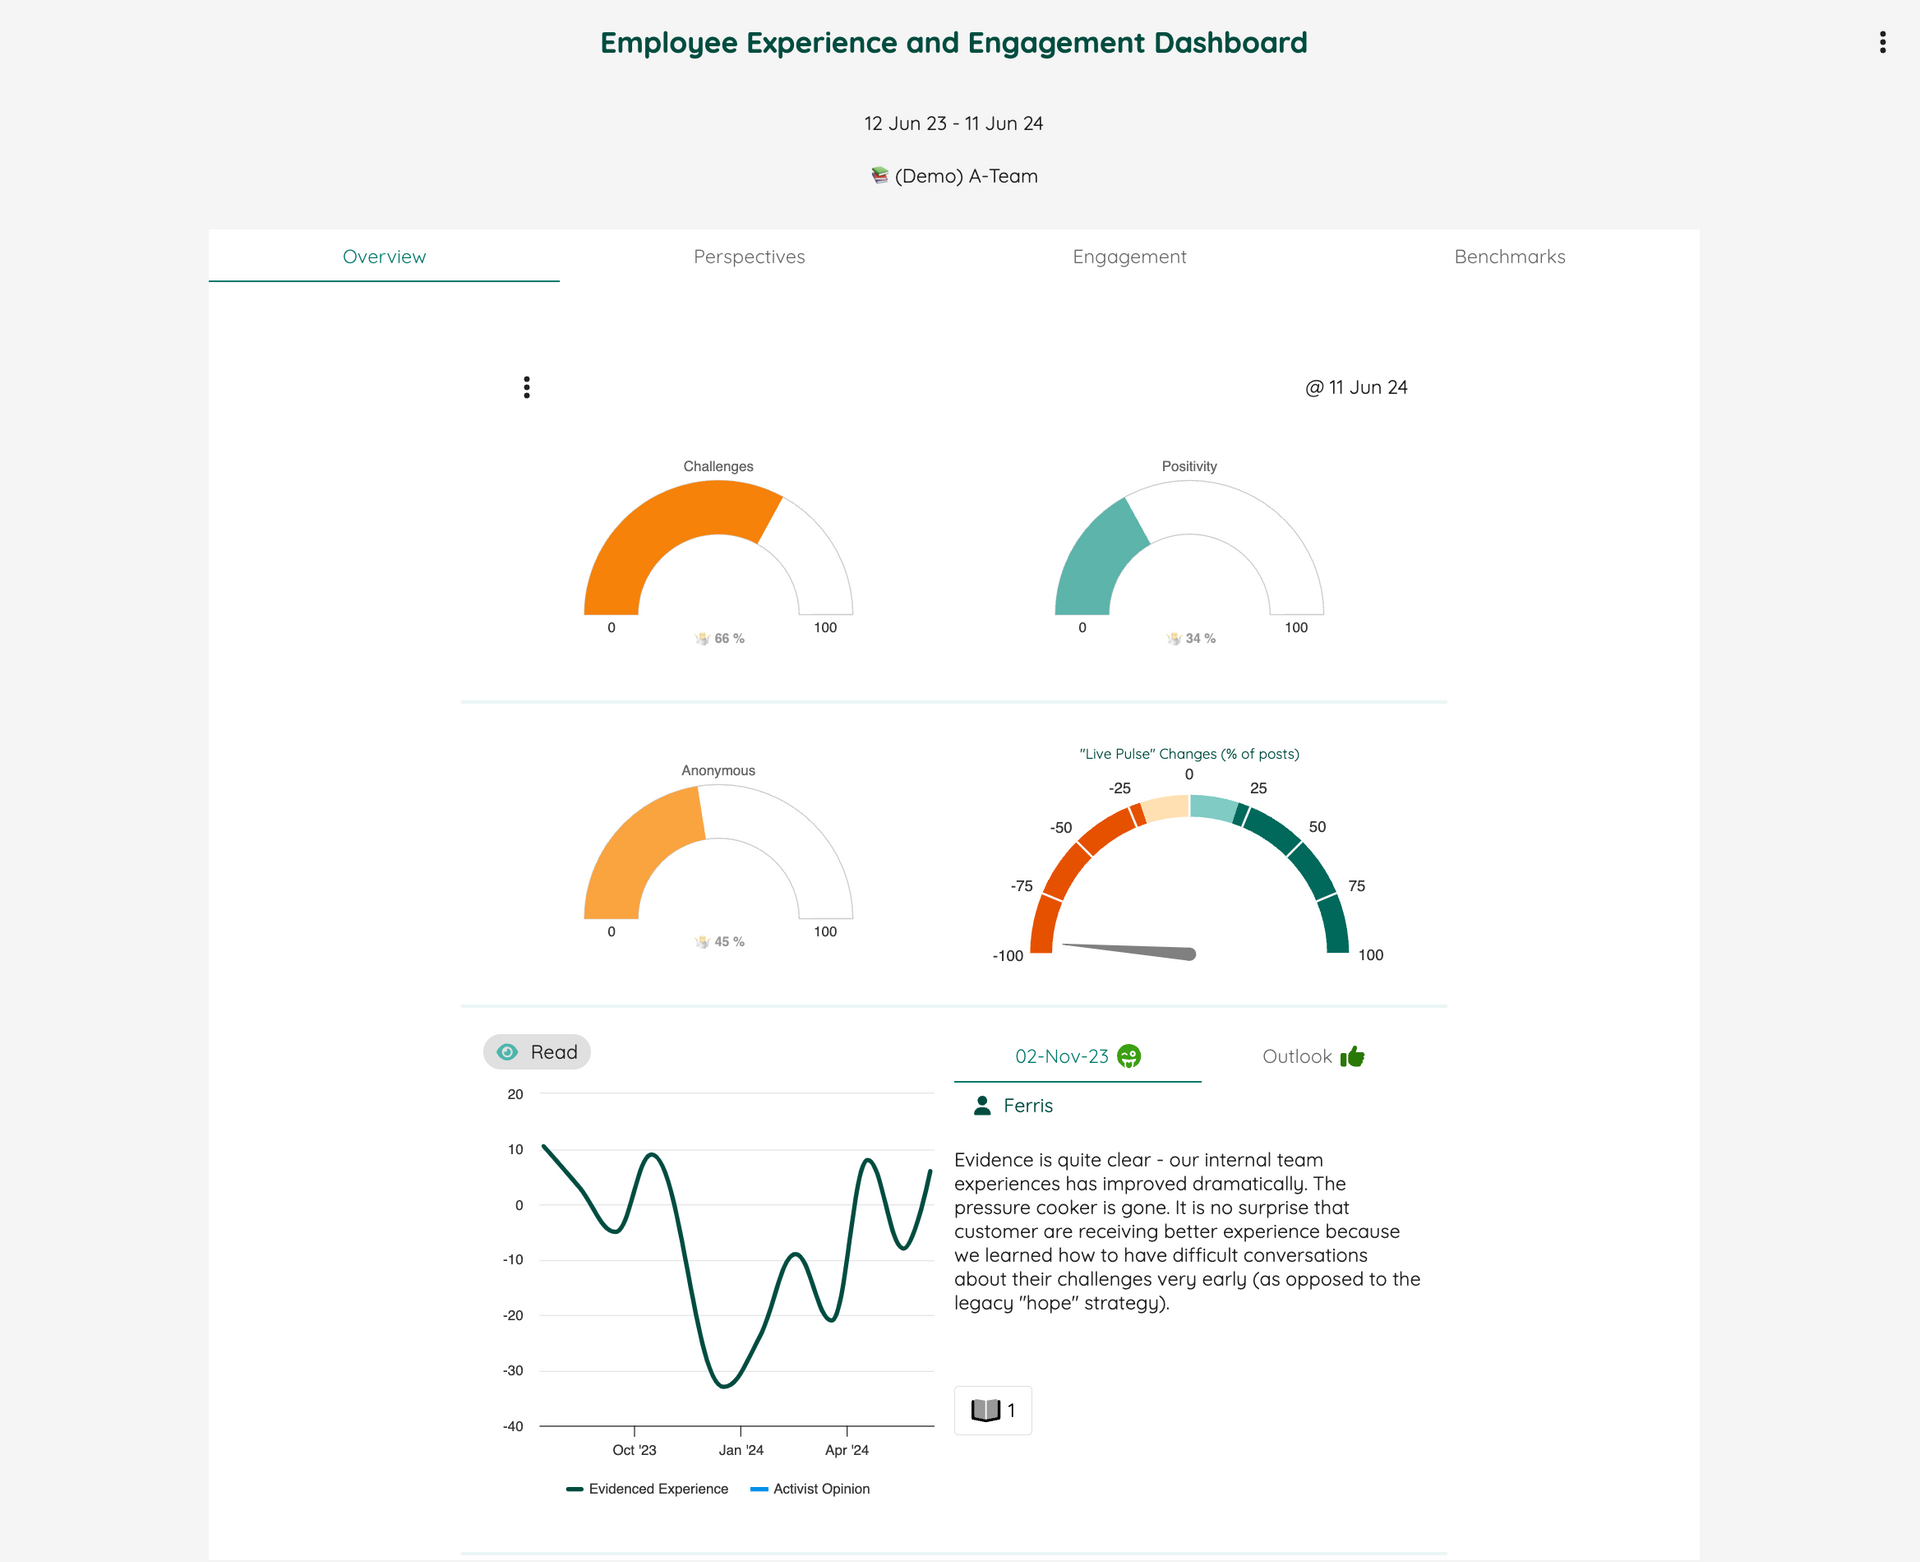
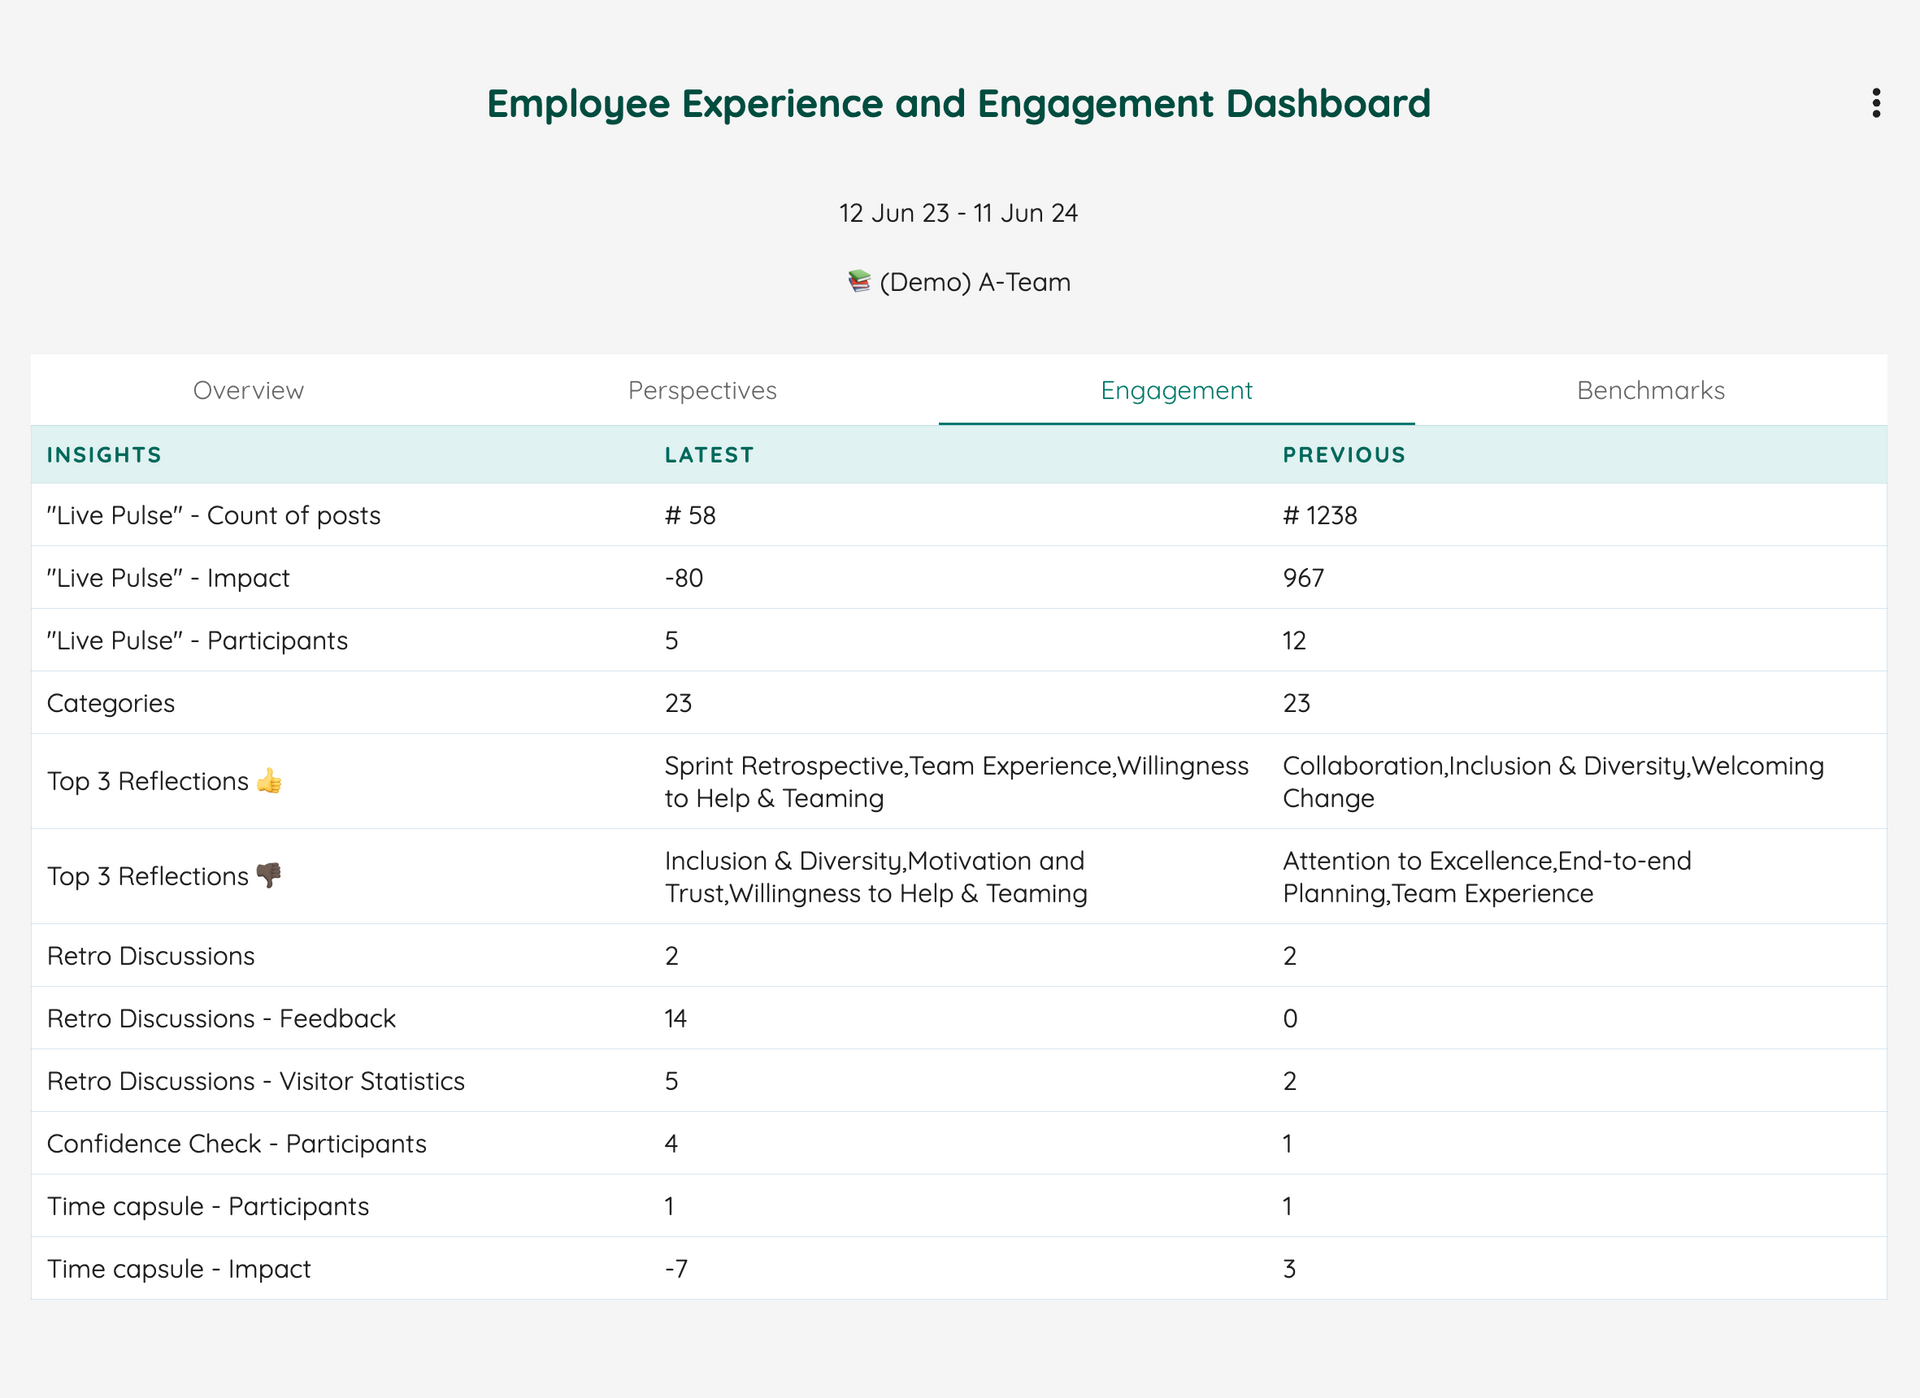
Boost you ability to measure wins and challenges within business processes, as well as employee engagement.
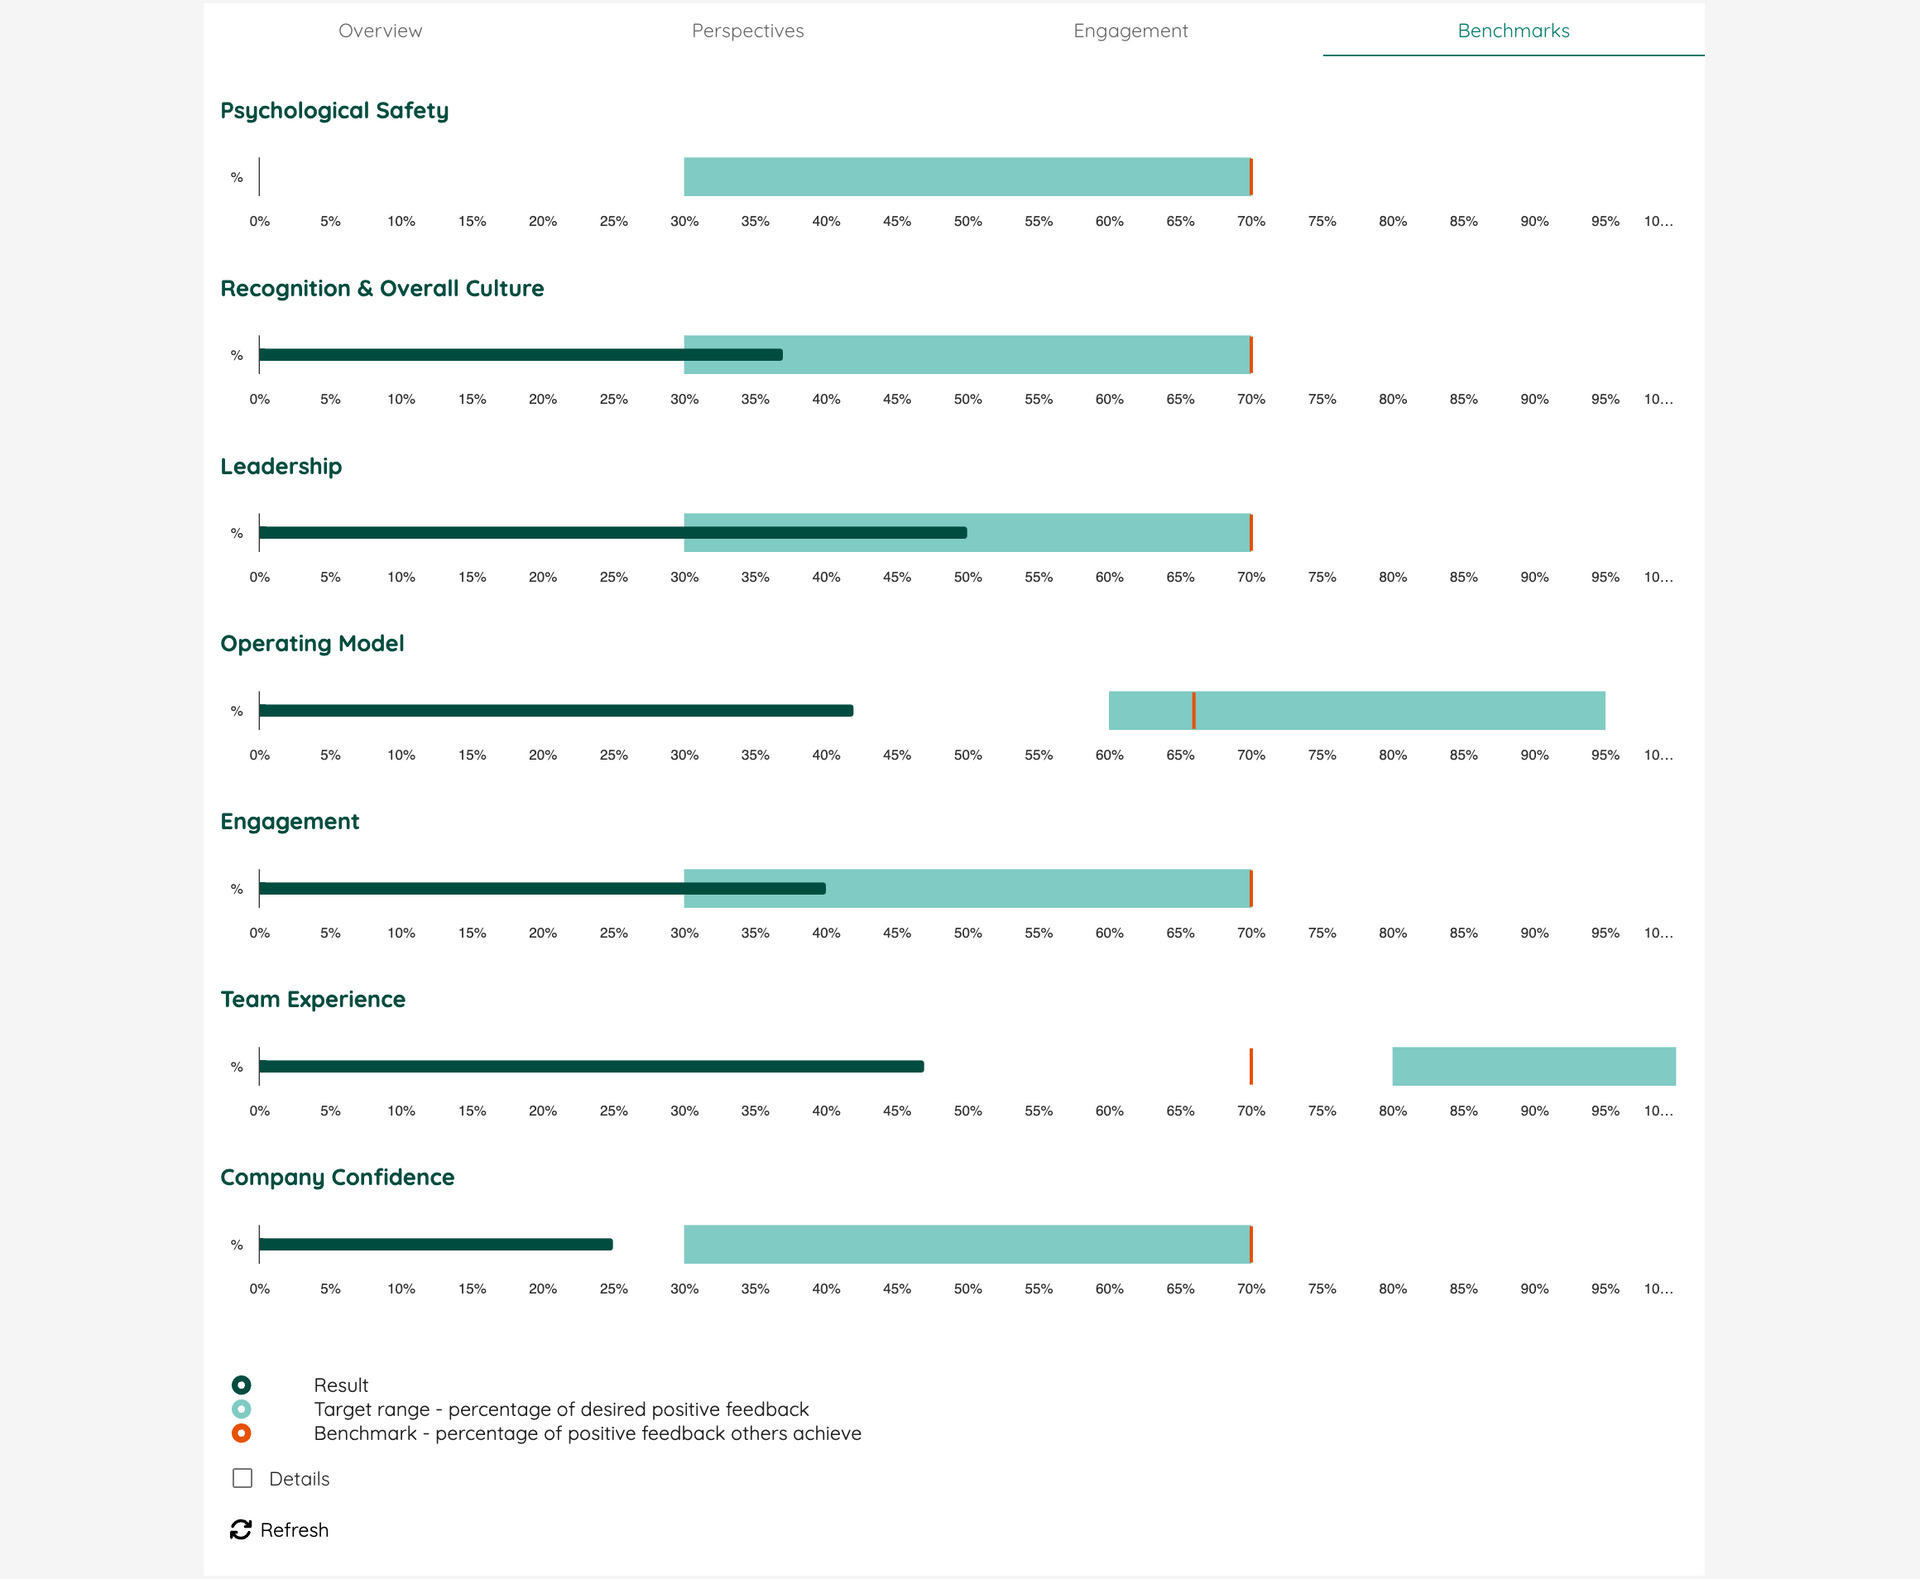
We provide real-time and authentic measurement of trends, specific themes, synthetic benchmarks and the impact of change.
Find ways to improve with real-time benchmarks.
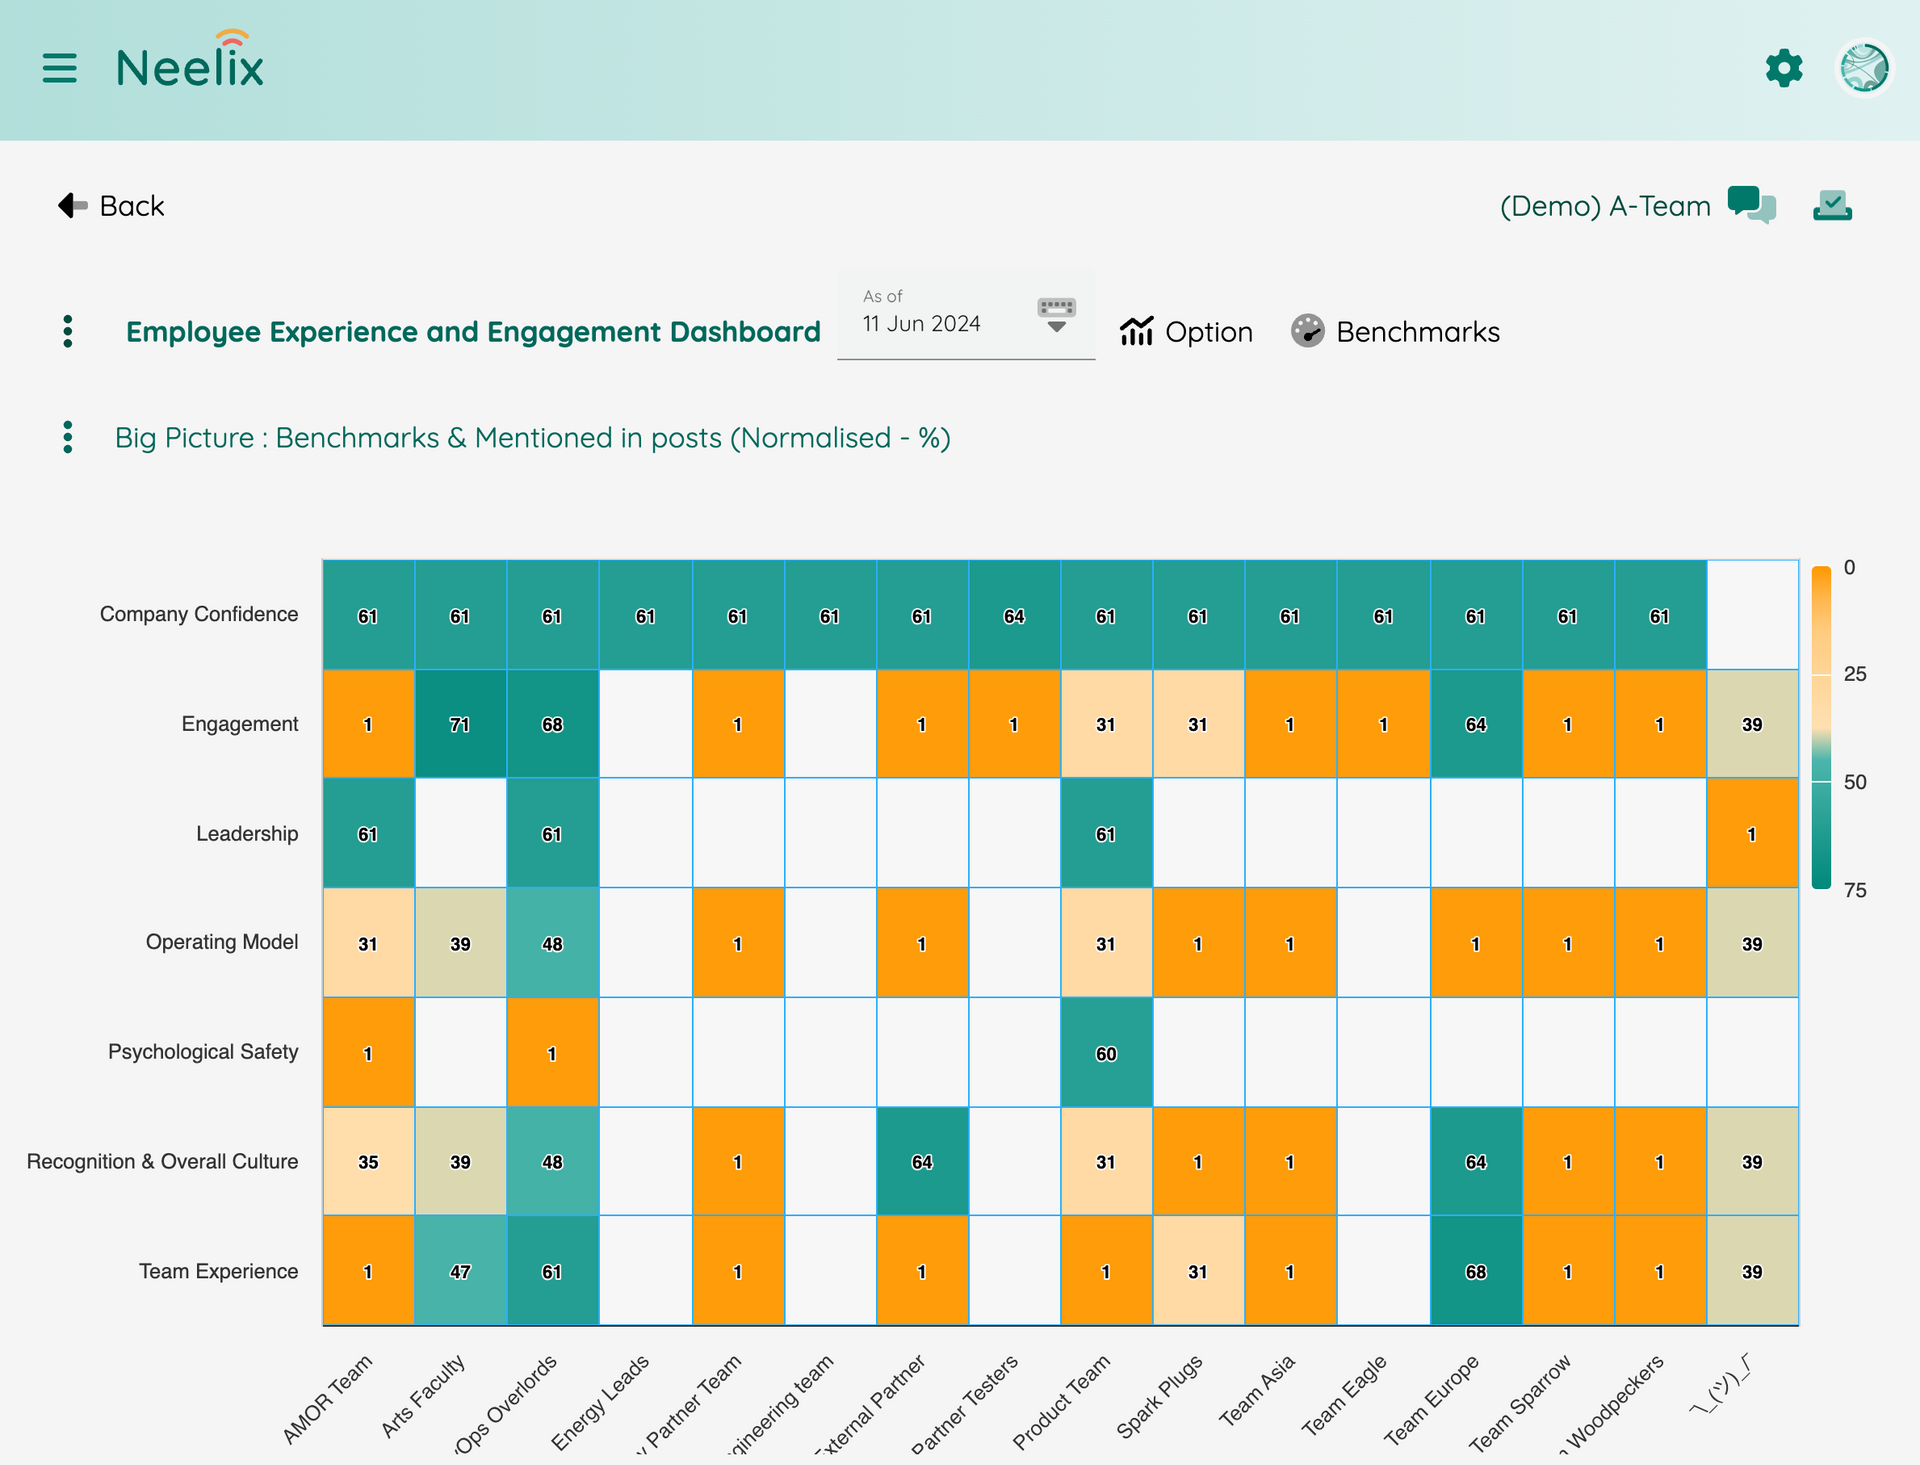
How to create a real-time dashboard
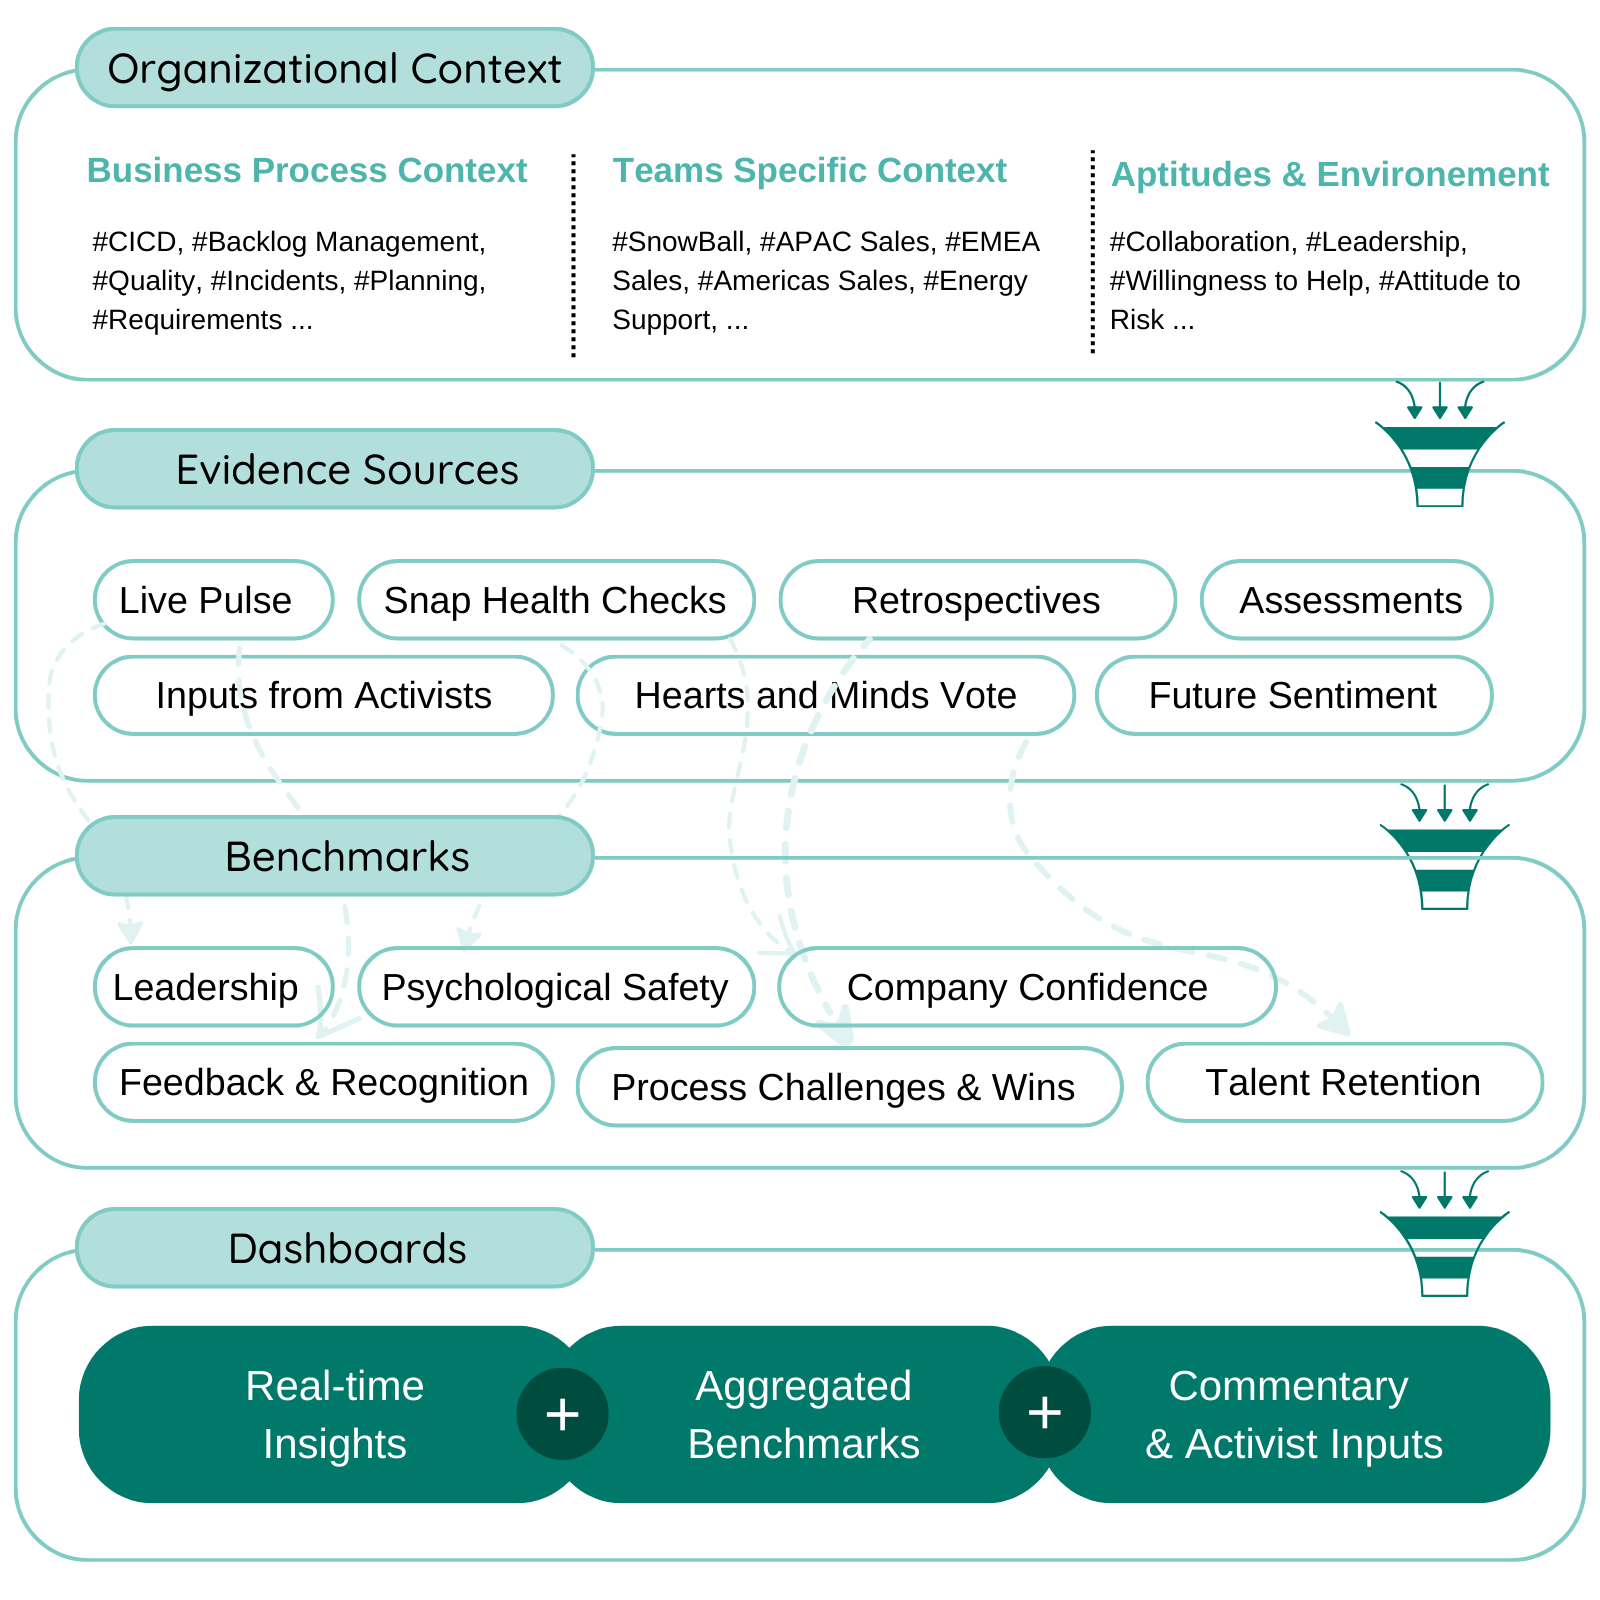
We provide an avenue for easy and innovative insights though democratised and triangulated data points:
- Create organizational context in the language that people in your teams can accept and appreciate
- Choose evidence sources - Live Pulse, Snap Health Checks, Retrospectives, Assessments, and more
- Craft benchmarks by selecting specific context from specific sources
Success is achieved by harnessing the "collective" mind of your people - their diversity of insights of strengths.
Team activist inputs
This is the text area for this paragraph. To change it, simply click and start typing. Once you've added your content, you can customize its design.
Workplace analytics
Real-time analytics derived from measurable and contextual feedback aggregated across sources Live Pulse, Snap Health Checks, Retrospectives, Assessments