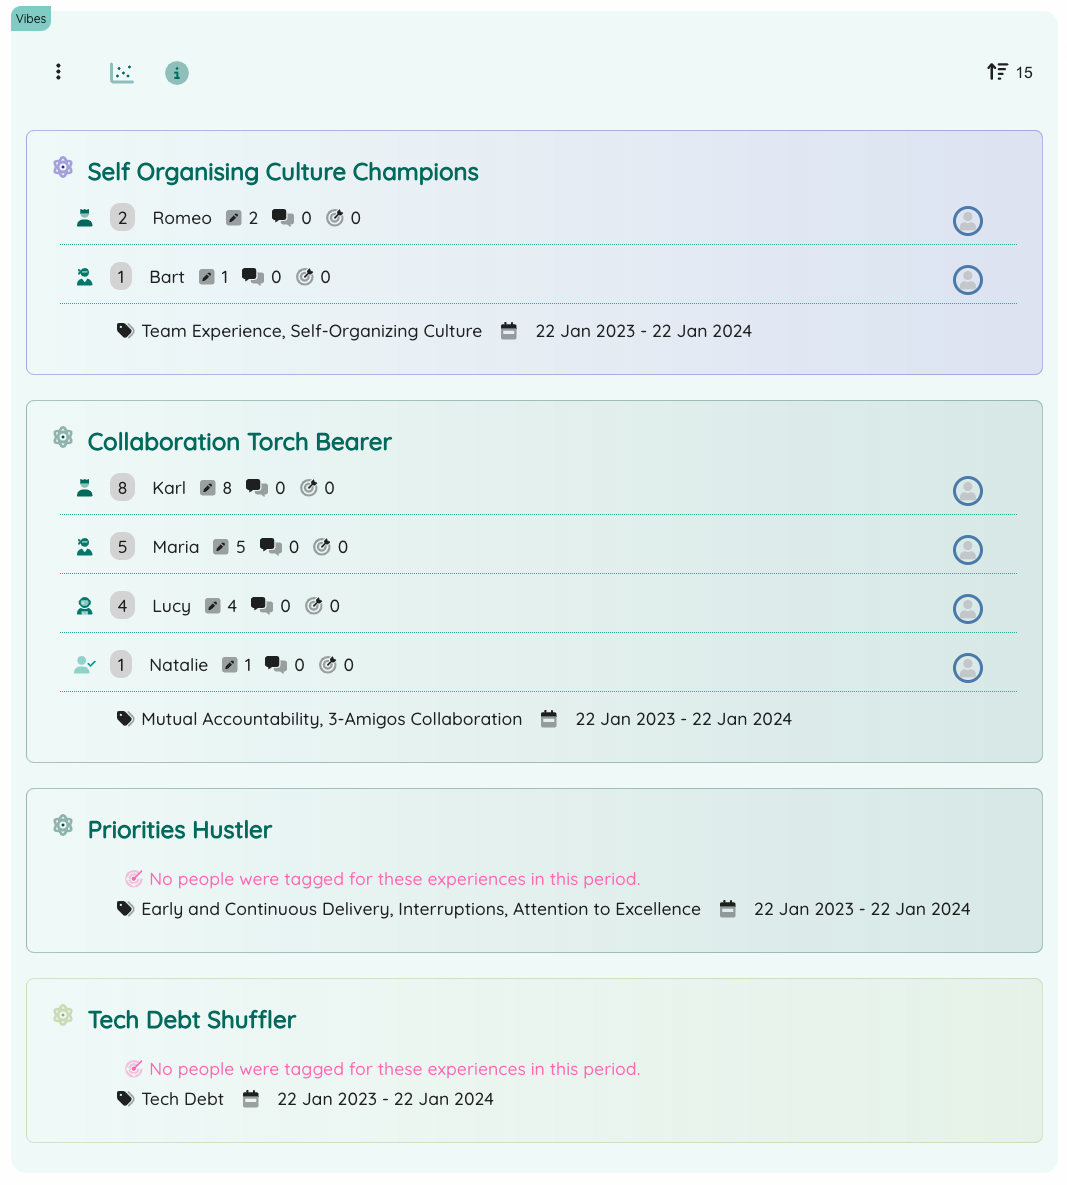
Live Pulse Driven Employee Experiences Board
Team Specific Workplace Humour

Stronger team culture
In today’s fast-paced work environment, maintaining high levels of employee engagement can be challenging. That’s where humor-assisted gamification comes into play, and the Live Pulse Driven Employee Experiences Board is at the forefront of this innovative approach. By integrating team-specific workplace humor into our gamified experiences, we create an atmosphere of camaraderie and enjoyment that aligns with your team's unique dynamic.
Humor can break down barriers, foster stronger interpersonal connections, and boost morale. This not only enhances alignment between team members but also infuses daily routines with a sense of fun and playfulness.
Utilizing humor, our Live Pulse Driven Employee Experiences Board helps build a robust workplace culture, where employees feel more connected, motivated, and aligned with their organization's goals. Discover the transformative power of humor and gamification in fostering a vibrant and cohesive work environment.
Broad Application
Humour assisted reflection of water cooler chatter type about wins and challenges. "Thank you's" recognition. Leader-board or even a competition.
Your Context
Fully configurable to your context (name of the board, swim-lane names, colours, icons, experience categories)
Zero Effort
Neelix aggregates data from ongoing experiences, and retrospectives
Normalise Data
Ability to normalise data (filtering by impact, absolute values, sorting options, etc.)
Time Filter Settings
Default look back period for the dashboard.
Filter for any date range in order to replay the journey or to inspect how scores differ depending on period.
Visual Bubble Chart
Easy bubble chart visualisation of mentions impact ranges

